Governor Hogan will be addressing the state at 11am on Monday, March 23rd. I debated holding these thoughts until after the press conference, but I think it’s safe to assume that Maryland will expand the shutdown measures, probably to include anything non-essential (full “stay-at-home” orders), and school closures will extend several weeks, if not through the end of the year. Anything else that’s announced, well… we’ll deal with that later. Seems like we’re stuck apart a bit longer (and that’s a good and important thing).
I said last time, that this pandemic will force dramatic and rapid economic, social, and personal changes on everyone, and those changes are unpredictable. But, in the words of Alan Kay, “the best way to predict the future is to invent it.” Now is the time to start thinking about how you want the world to look on the other side of this thing, and begin to but those visions and hopes into actionable form. I’m very much looking forward to thinking those things with you… we have a whole new world to build…
Many of you are going to be stuck at home for an indefinite period, uncertain of the health of people you care about, your personal income, the stability of your business, and so much more… this sucks. This sucks a lot. It’s OK to not be OK. If you need help, please ask – I’ll do what I can, and there are other resources to draw upon. Here are some places to look:
The great people at Impact Hub have created a document aggregating resources here: https://docs.google.com/document/d/1nN_1iWwqjt6swhDBGeG4BUxOUXuS-oLYhZaqnKPfLxI/edit
Baltimore is organizing neighborhood response teams here: https://docs.google.com/document/d/1G5JcyxmywcTdNeaSGxUNycl9mtCdGkF4MYPVxEBH4SY/mobilebasic
Baltimore Development Corporation is collecting information on businesses and non-profits impacted by the pandemic. You can participate here: https://colintarbert.typeform.com/to/YRr3Bu
And if you’re still feeling good about surveys after all that, a gentle reminder that the Baltimore Regional Dance Survey (#BRDS2020) needs more participation… Please make sure you’ve completed it yourself, and share with anyone else in your dance world. http://inthedancersstudio.com/brds2020
A few people have connected already, but I’ll re-iterate the invitation… If you want to talk about any of this stuff (even if it’s not about dance, but especially if it is…), I’m happy to do so.
If you have any personal protective equipment (especially gloves and masks) that you don’t need, please consider donating it to a local hospital.
Please get good information.
Please stay home.
Please keep dancing. (has anyone started working on the “social distance ballet”?)
Please reach out to people directly and personally. They will miss seeing/dancing/working with you. I will miss you.
Simple acts of kindness do matter. Point out beauty when you can. Bring a little joy to someone.
If there is something I can do, please let me know.
———- just fun down here ———-
And, to brighten up a few artist’s lives today…. with an extra helping of cheesy for now….
From Vietnam’s Health Ministry almost a month ago (22 million views, but, don’t miss out) – https://www.youtube.com/watch?v=BtulL3oArQw
My Corona by Laurel B. and the Knack – https://www.youtube.com/watch?v=xumSryclYgg
Stay Inside! by Urian Hackey (with love from Nirvana) – https://www.youtube.com/watch?v=60NuAvPiPlE
Shuffle Dance by Andre Serox – https://www.youtube.com/watch?v=QUYH4UiwUaM
And in the hospitals, dance matters…
From Wuhan – https://www.youtube.com/watch?v=GZcpYSkcYPM
From Iran – https://www.youtube.com/watch?v=wamoQYVI0ww
Not everything stops for pandemic
You’ve probably seen a torrent of notices about things that aren’t happening anymore (I have…), so I want to change that tone a little bit – I hope most of this message resonates about things that WILL happen. COVID-19 is a global pandemic and things you do now do matter. Get good information.
It seems apparent that the spring dance recital season is essentially over well before it began. As someone whose income depends on groups of people gathering together, I know this is a very real, very scary proposition across the dance community. This pandemic will force dramatic and rapid economic, social, and personal changes on everyone, and those changes are unpredictable. Times of crisis do make great art, but that won’t make 2020 less challenging as it unfolds in real-time for you. If you want to talk about this stuff, I’m happy to do so.
I WILL continue to work on dance, but I probably won’t be inviting you to meet me for lunch or dinner anytime soon, and I probably won’t see you at a spring concert this year. That makes engaging with what you’re doing (or not doing…) more difficult, but more important than ever. The Baltimore Regional Dance Survey continues (please continue to participate and share…). Work on the Lord Baltimore Theater continues (please reach out with your thoughts and skills…). Work on documenting dance in the region continues (please tell me those stories…). Please do get in [electronic or telephonic] touch.
Some other potential things-to-do:
- The Maryland State Arts Council is holding three (for now) “Listening sessions” – March 19 and 20 (so far no weekends scheduled). More information here: https://www.msac.org/news/msac-listening-session-how-can-we-help
- If you are not insured, or know someone who is not insured, I urge you to do some shopping. The Maryland health insurance exchange has opened a special enrollment period through April 15: https://www.marylandhealthconnection.gov/coronavirus-sep/ This is probably a really good year to have health insurance…
- If you run a business (for example, a dance studio…), the Maryland Department of Commerce has assembled potentially useful information here: https://businessexpress.maryland.gov/coronavirus Information includes employment/unemployment and things like low-interest loans, taxes, and permits.
- The Maryland State Arts Council has a new grant program – “Special Request Grants.” Information here: https://www.msac.org/programs/special-request-grant This is a relatively restricted program (designed to fill gaps in existing grant programs), and for this first round, the funding period is a bit more than one year (this cycle ends June 30, 2021). Funding is available now, but may be depleted before the end of the cycle (not clear on that…). Apply early.
- The Maryland State Arts Council has a new grant program –
- “Professional Development Opportunity Grants.” Information here:Â
- https://www.msac.org/programs/professional-development Funding available up to $2000. This funding period is much shorter, ending June 30, 2020, but application is required 90 days prior to the funded activity, which means apply now for activities in June.
Please stay home.
Please keep dancing.
Please reach out to people directly and personally. They will miss seeing/dancing/working with you. I will miss you.
Simple acts of kindness do matter. Point out beauty when you can. Bring a little joy to someone.
If there is something I can do, please let me know.
Space for Tennis
A [un]fun fact from a geospatial analysis of recreation in Baltimore…
Baltimore is home to over 230 outdoor tennis courts (about half of them operated by the city). A tennis court takes up 7200 square feet. About 2800 square feet of that is the in-bound area, and there’s some overlap outside the lines where courts are adjacent. This means that tennis players in Baltimore have access to more than 1.2 million square feet of dedicated, purpose-built space.
That’s enough space for one thousand 30×40-foot dance studios.
About 5% of Americans play tennis.
The Baltimore City Department of Recreation and Parks lists 40 recreation centers, 120 playgrounds, 170 athletic fiends, 110 tennis courts, 101 basketball courts, and 29 aquatics facilities in its inventory. Of these, dance classes are listed in 6 of 40 rec centers.
BRDS2020 is Live
The Baltimore Regional Dance Survey (BRDS) 2020 Edition is now live. This year, it’s January 1st! Click this to register and participate at your convenience.
The purpose of the Baltimore Regional Dance Survey is to gather sufficient information on dance and the dance economy in the Baltimore region to identify gaps and opportunities, help direct resources to address those gaps and opportunities, make informed and credible policy recommendations when questions impacting dance in and around Baltimore arise, and to help dancers throughout the region understand and work with each other to create a more constructive and productive environment for dance.
The only major change from last year is a question about current (well, 2019) dance habits, in contrast to your life-long personal dance history. This will address situations for dancers that started in (for example) ballet, but moved on to something else later in their career.
The Baltimore Regional Dance Survey is anonymous and entirely voluntary. All questions, except the first couple (which determine the parts of the survey that are relevant to you), are optional. You can share as much, or as little information, as you want. You do need a valid email to register, but your answers are anonymized and not associated with the email.
2020 is the most important year for the Baltimore Regional Dance Survey. There are several real “brick and mortar” opportunities in and around Baltimore. Broad, representative participation in the BRDS is the most convincing data I can offer when someone asks why they should do something for, with, or about dance in Baltimore. I’ll be making that case for some people as early as late January, so please be counted! Everyone that learned or taught dance, choreographed, performed, worked with or supported dancers in the Baltimore region during 2019 is encouraged to participate. We really do mean everyone – the experience of the newest, just-had-my-first-class dancer is just as relevant as in-business-for-decades studio owner.
Please participate yourself and share this page ( http://inthedancersstudio.com/brds2020 ), the direct registration link
( https://www.inthedancersstudio.com/s/index.php/788622?lang=en ), and the tag #BRDS2020 with your dance colleagues, students, teachers, mentors, coworkers, and friends.
March 1 2020 Update: I’ve fixed a field-length problem with one of the performance-block questions. I don’t think this will impact results (I think we can figure out the abbreviations used so far), but you now have more than 5 characters to describe your preferred performance venue.
BRDS2019 is Live
The Baltimore Regional Dance Survey 2019 Edition is now live. This year, much, much closer to the period of interest (calendar year 2018) – it’s still January! So, memory is a bit fresher, and hopefully that will make things go faster and easier.
Major changes in the 2019 survey include a few new questions about dance competitions, and a greatly expanded structure for dance spaces.
Several comments about the 2018 survey expressed frustration with the “one size fits all” nature of the site-specific questions. So, for 2019, you don’t have to generalize your answers across all the spaces you’ve been in during 2018 (but you are limited to 12 different spaces for each kind of use). Hopefully this will work out better for everyone.
It’s been a busy time, and I’m grabbing as many windows of opportunity as I can, but there’s a lot to do. I decided to prioritize the BRDS launch, so that put the analysis of the 2018 results on a back burner [again]. Still working, I promise!
To be meaningful, BRDS still needs to reach a wider audience. Any suggestions or help you can provide is most welcome. Please share this page ( http://inthedancersstudio.com/brds2019 ), the direct registration link
( https://www.inthedancersstudio.com/s/index.php/941437?lang=en ), or the tag #BRDS2019 with your dance colleagues, students, teachers, mentors, coworkers, and friends. Everyone that learned or taught dance, choreographed, performed, worked with or supported dancers in the Baltimore region during 2018 is encouraged to participate. We really do mean everyone – the experience of the newest, just-had-my-first-class dancer is just as relevant as in-business-for-decades studio owner.
Also coming in 2019, we’ll begin studying the impact of dance performance on the audience. If you’d like to participate, please get in touch.
Speaking of getting in touch, several people expressed specific challenges in BRDS2018, and I have [potential] solutions for some of you, but… I don’t know who you are. I’m happy to share what I know with anyone that can benefit, but please remember that the BRDS surveys are anonymized, so you have to reach out and let me know how to get back to you. Please don’t hesitate. You are the reason I’m doing this.
BRDS2018 Analysis begins – Baltimore City Respondents
A little later than I had hope, and this will take longer than last year, but I’ve begun digging through the BRDS 2018 responses.
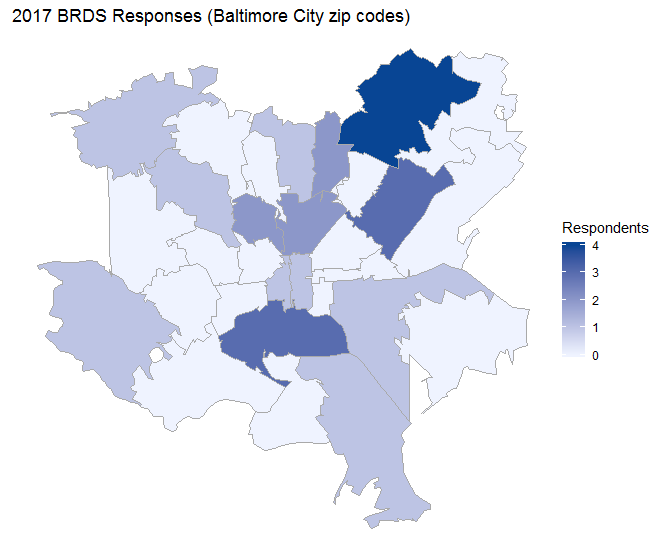
A bit less than half of respondents provided their zip code, but of those that did, BRDS is still having trouble reaching people in Baltimore City –
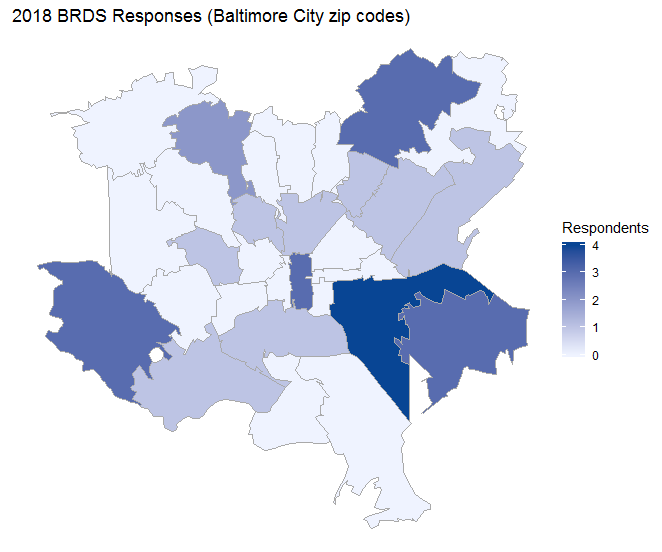
This is pretty different than the 2017 responses (obviously, some people did not come back for the survey this year):
It’s a been a lot of months since the end of 2017, but in the interest of filling in gaps, I’ll leave the survey open. If you have any suggestions about reaching into those parts of the city, please let me know.
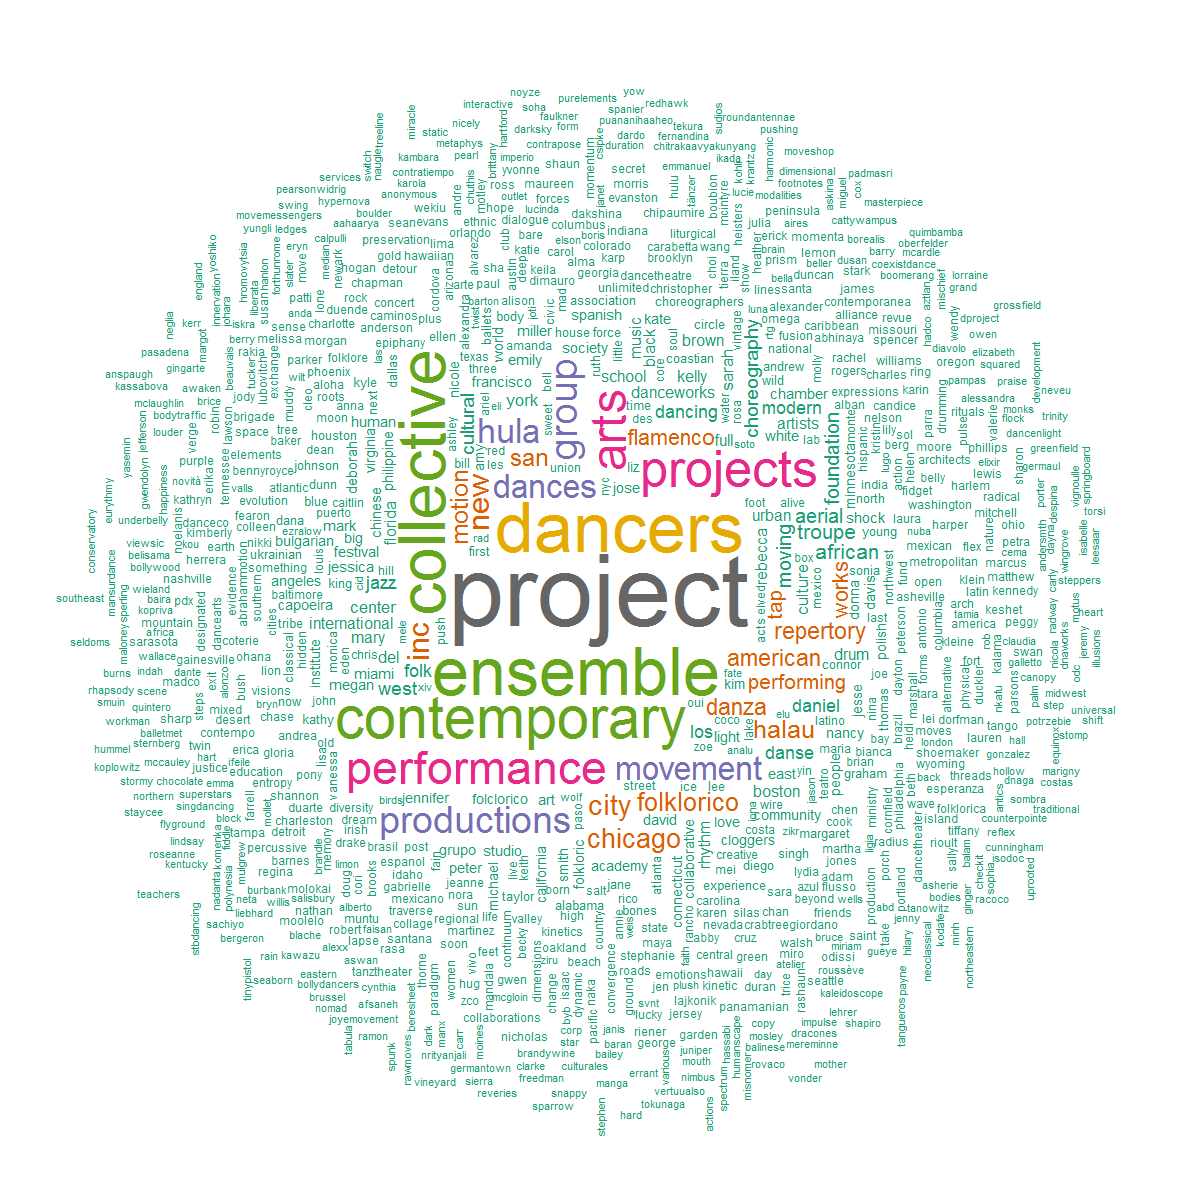
Dance company wordcloud
As you might imagine, I’ve been trying to find (or make) good data on the business of dance. This is no small challenge, but that doesn’t mean it can’t be a little fun along the way.
Some people like graphics, so this is a little fun for today. From a collection of 2639 dance company names, dropping “dance,” “ballet,” “company,” and “theater” (both variations), what do dance companies call themselves? Something like this:
Breakdance finals from Artscape 2018
Even in the rain, Baltimore dances.
Why are you dancing?
Asking an interesting question over at dancewriterbaltimore – Are we dancing for the likes?
2047 Apologue – Weaving Machine
About one year ago (June 2017) director Zhang Yimou presented 2047 Apologue at the National Centre for the Performing Arts (NCPA) in Beijing.
2047 Apologue consisted of eight performances prepared by 20 international and local teams, culminating with the performance of “Weaving Machine.”
Weaving Machine was developed by Wu Shuxiang (China – weaving), Rose Alice (co-director of the International Arts Collective in London – dance), CPG-Concepts (Hong Kong – choreography), Radugadesign (Russia – video elements), and WHITEvoid (Germany – lighting elements). Technology includes 640 motorized LED spheres from Kinetic Lights.
Being human, in olden days we sat down and talked face to face, our face turns red with embarrassment, but we can feel each other’s emotions close up – fears, anger, sadness and happiness. Will we still have these feelings in the future?
In this dialogue between ancient culture and modern technology, we experience puzzles that comes with the rapid progression of technology, and reflect on it – what will be the future relation between human and technology?
The most difficult task for this show is getting the audience to accept and acknowledge that their lifestyle, the way they communicate and the way that they work might not be the best
–Zhang Yimou
2047 APOLOGUE – Weaving Machine from Radugadesign on Vimeo.
More information at Behance.