Outside the Student-Performer-Teacher tracks within the survey, we also asked respondents if they also provide services to dancers. Given then relatively small sample size, I am a bit surprised that every service category provided was covered by someone in the survey. A reminder of those categories:
Performance recording
Performance broadcast
Co-working and meeting space
Costume services
Marketing services/assistance
Health and wellness
Accounting/Business services
Non-dance classes (e.g., Marketing, Audio production)
Physical therapy
Music creation and editing
Job placement/Career information
Financial assistance
Housing information/Referrals
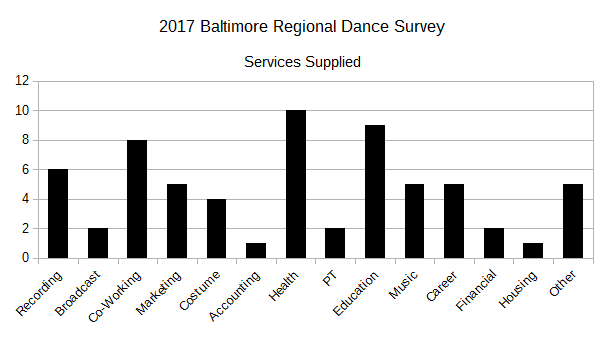
Only 25 respondents completed this track through the survey. Here’s what that looks like:
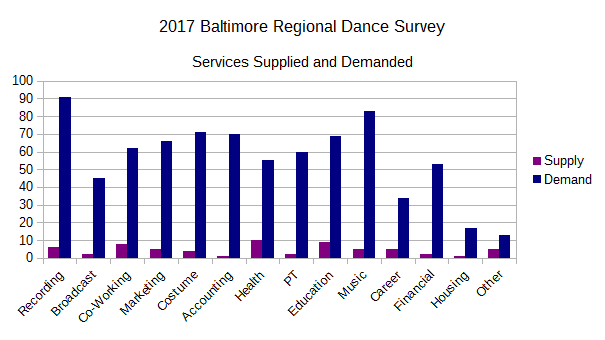
How does this compare to the demand for these services? Well, first off, the demand numbers dwarf supply numbers – and that’s ok. As a dancer, you don’t need a one-to-one relationship with your accountant. That said, it’s also not as easy as just being an accountant (or any other service provider) – some understanding of how dance works would help. This does give some insight into how services might work within the dance community (dancers doing it for themselves), and where outside specialists might engage.
With that huge difference in scale, it’s hard really understand what might happen here. Let’s try scaling services supplied to demanded (multiplying suppliers by 12, which is the whole number closest to the average demanders divided by the average suppliers). So that looks like this:
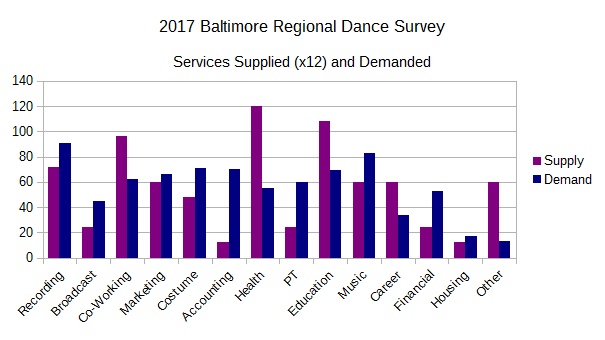
Does this really mean anything? No, too many arbitrary leaps from too small a dataset, but maybe this is an indication of where to go in the future.