The first question in the Baltimore Regional Dance Survey was… complicated. There were several iterations about how to capture three dimensions (Performing, Teaching, and Learning) of a dance career with one question, and I’m still not entirely satisfied with the structure of the question. That said, the BRDS did attempt to measure the relative engagement for these three dimensions. Respondents were asked “On average, how did you divide your time as a dancer in 2016?” in each of Performing, Teaching, and Learning. Available responses for each were “None at all,” “A little,” “A moderate amount,” “A lot,” and “A great deal.”
I’m sure there is a large sampling bias favoring older individuals and teachers represented here (some discussion of the known bias here). So, with biases firmly in mind….
All 80 valid responses (see this for validation criteria) made it through this question (along with another 40 incomplete and invalidated responses – which is why we may come back to those later). Focusing for a moment on only the most-engaged (“A great deal”) responses, only 8 respondents (10%) said they performed “A great deal” in 2016. Twice as many (16) spent a great deal of 2016 learning, and more than 4.5 times that many (37) claimed they spent a great deal of 2016 teaching. Bias confirmed…? At the opposite end of the spectrum (“None at all”), we find 16 respondents did no performance, 11 respondents did no teaching, and 4 respondents did no learning during 2016.
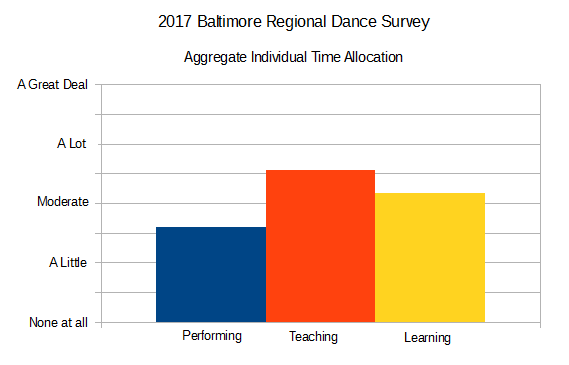
For math, these responses are assigned values from 0 (“None at all”) to 4 (“A great deal”). Aggregating all responses to this question, performing scores 1.6 (between “a little” and “moderate”, teaching scores 2.6 (between “moderate” and “a lot”, and learning scores 2.2 (also between “moderate” and “a lot” but more moderate…).
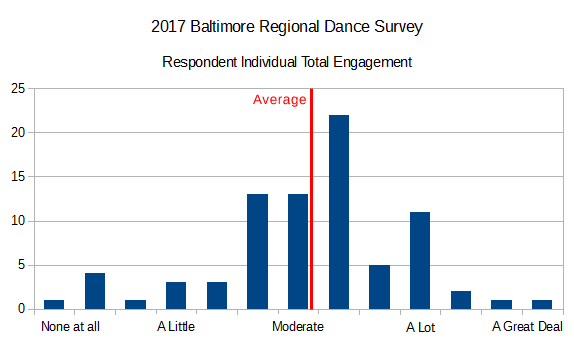
Looking at this from the opposite perspective – each individual respondents’ total engagement, one respondent picked “None at all” for all three categories. The highest individual “score” was 4.00 (“A great deal” in all three dimensions). Between these extremes, the average for this group of 80 respondents was 2.1.
Breaking out each of the three dimensions, we get a picture like this…
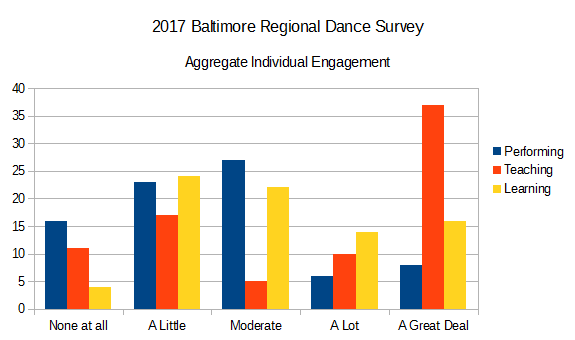
Which reveals that heavy teaching bias discussed previously.
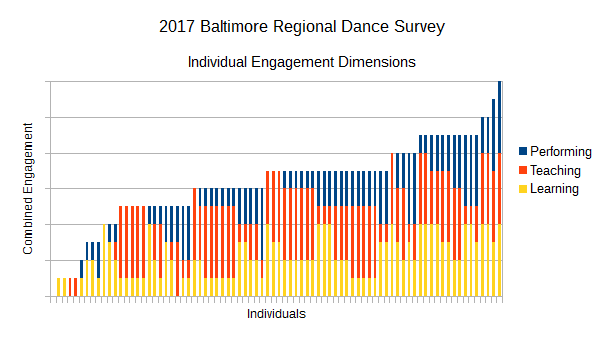
Because we do have a relatively small data set, we can get totally granular. Below, all 80 valid respondents, ranked left-to-right according to their self-reported combined engagement level (Performing + Teaching + Learning), which ranges from 0 (“None at all” in all dimensions) to 12 (“A great deal” in all dimensions).
So that’s a first pass through what Baltimore dancers do with their [dancing] time. In this sample, mostly teaching and learning. Will additional data give any clues about why there isn’t more performance going on? Stay tuned…
One thought on “How Do Baltimore Dancers Spend Their Time?”