In the last installment, I did a broad overview of what sorts of dance happens in Baltimore, in three dimensions (Learning, Performing, and Teaching). This time, I’ll focus a bit on the level of engagement for the three dimensions (Learning, Performing, and Teaching) within each dance form.
In general, I would expect that people learn a dance form first, then maybe start performing, then maybe start teaching. In some forms (Ballet), progression to the stage and to teaching may be highly dependent on the blessings of one or more teachers, while in others (Belly dance, Liturgical), it’s more likely that the decision to perform is entirely personal. In some forms (Folkloric, Indian), local advanced learning opportunities may be extremely limited – if a dancer is committed to a form, and there isn’t a “next-level” instructor around Baltimore, they will have to go elsewhere to take those next steps. In some forms, where there only a limited number of instructors teach in the region, training may simply stop after a short period of time.
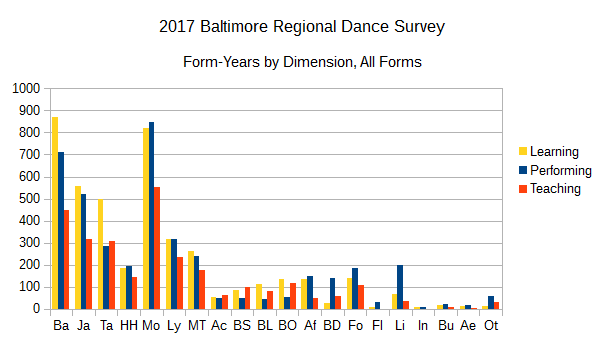
For many reasons, it’s difficult to plot a common trajectory for a dancer from student to performer to teacher, but we do have some data that might illuminate this a bit. It’s important to note that these questions cover an entire career, and so provide no insight into the temporal relation between being a student, being a performer, and being a teacher – it’s impossible to determine if someone started teaching hip hop before they took a hip hop class, only that they’ve been teaching more or less total time than they’ve been studying. Total number of years looks like this:
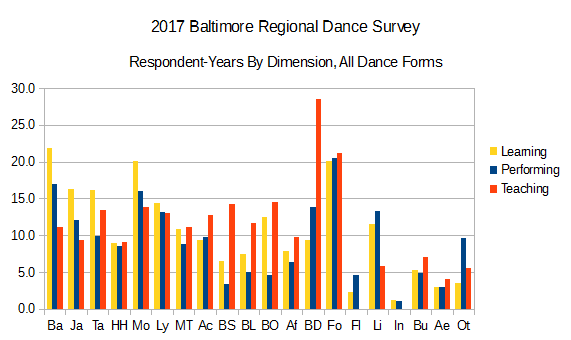
Dividing total years in each dimension by total respondents for that dimension, we get this:
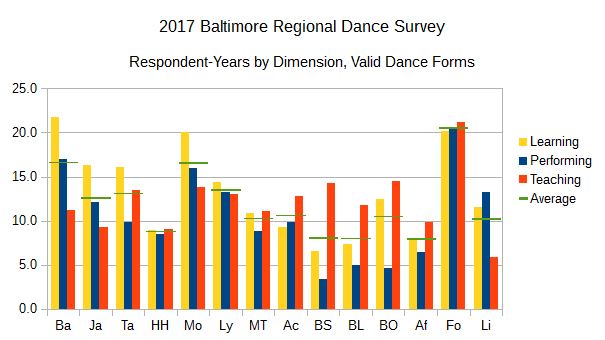
In several cases, there’s just not enough data to be meaningful. Where we have zero reported years of teaching (Flamenco, Indian), there’s no relationship to draw between teaching and anything else. Where only one or two respondents count (Teaching Belly Dance, Burlesque, Aerial), we’d be speaking about an individual experience rather than a meaningful insight into a dance form. We can also exclude Other (too many variables). That leaves a slightly-easier-to-read chart:
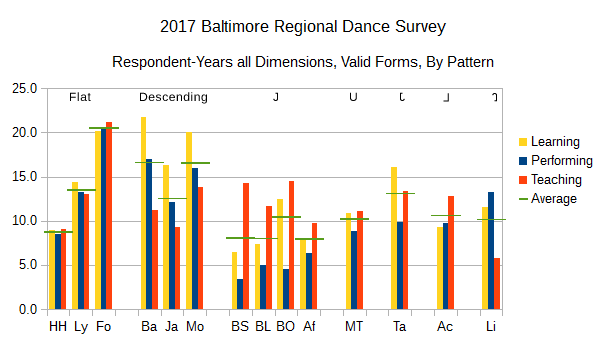
From here, a quick look reveals some interesting relationships. Hip Hop, Lyrical, and Folk forms have essentially the same commitment to learning, performing, and teaching. This isn’t enough to say that Hip Hop is modern American folk dance, but it was interesting to see these two together (and Folk dance in this survey does cover a lot of territory). Ballet, Jazz, and Modern follow a straightforward descending pattern through these dimensions (More learning than performing, and more performing than teaching). All of the Ballroom forms, plus Musical Theater, Tap, and African follow a “U-shaped” pattern, with less time spent performing than on either learning or teaching. The Ballroom forms and African make that more of a “J” (more teaching than learning) and Tap sort of flips that J backwards (more learning than teaching). Acro alone inverts the descending pattern of Ballet, with emphasis on teaching, so more of a backwards-L shape. The last pattern in this set – Liturgical where there’s much more learning and performing than there is teaching. Perhaps Liturgical dancers take more of an on-the-job approach to learning their craft (or we just missed the instructors).
That’s a lot of words. Visually organizing this is a bit easier:
These patterns made me a little curious about a potential economic implication. It’s probably safe to assume that, in general, the learning years in any dance form represent an expense, and the teaching years in the same dance form represent potential revenue. It is a small sample, but which forms demonstrate the highest teaching-to-learning-years? This format exaggerates the relations to make “clusters” more obvious (there’s not a lot of statistical meaning here, because of the sample size. This is essentially one-dimensional data plotted in a two-dimensional format):
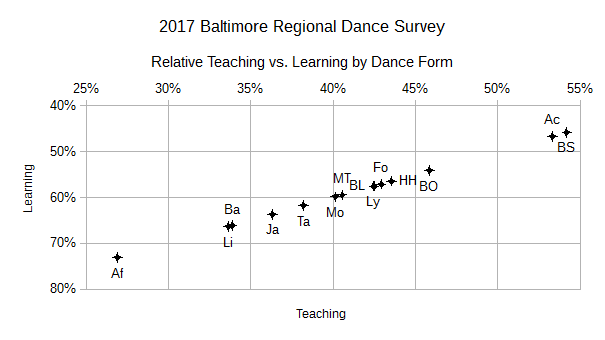
There are some form-specific implications – for example, Musical Theater dance is just a part of a Musical Theater career (acting and singing lessons aren’t captured in this survey), and Liturgical dance classes may not involve much economic activity for either teachers or students, but… interesting. Standard Ballroom and Acro stick out in the upper-right end of this chart, and are the only two where Teaching years exceed Learning years in this dataset, but probably for different reasons. African also stands out at the opposite end of the chart, and I don’t know why – probably in part a sampling error (only 5 respondents spent any time teaching African).